


Table of Contents
- Executive Summary: The Quiet Accumulation Amidst Retail Apathy
- Market Overview: The Macro-Crypto Divergence
- Headlines: Security Failures & Corporate Treasuries
- Hot Sectors: Decentralized Storage & The Stablecoin Standard
- On-Chain Data: Liquidation Heatmaps & The $90k Wall
- Chart Interpretation: Technical Structures in a Low-Liquidity Environment
- Fundraising: The Capital Engine Shifts to Utility
- Regulation: The GENIUS Act & Global Compliance
- Institutional Analysis: The "Alchemy of 5%"
- Macroeconomic Analysis: Gold, Equities, and the Search for Value
- Outlook for Next Week: The January Effect & Key Unlocks
1. Executive Summary: The Quiet Accumulation Amidst Retail Apathy
As we close the final week of 2025, the cryptocurrency market presents a profound paradox that defines the mature phase of this cycle. We are witnessing a historic decoupling between sentiment and structure. On the surface, retail enthusiasm has all but evaporated. Search volume for "crypto" and "Bitcoin" has plummeted to yearly lows, with Google Trends data indicating a score of just 19 out of 100, comparable only to the depths of the 2022 bear market.1 The anticipated "Santa Rally" failed to materialize in price action, with Bitcoin languishing in the high $80,000s, significantly below its October all-time high of $126,080.2 The "Fear and Greed" indices across major platforms are firmly entrenched in "Fear" territory, signaling a capitulation of the casual speculator.1
However, beneath this veneer of apathy lies a robust undercurrent of institutional accumulation and infrastructure maturation that paints a radically different picture of the industry's health. While individual investors have left the building, entities like Bitmine Immersion Technologies have aggressively expanded their balance sheets, now holding over 4 million ETH—nearly 3.4% of the entire circulating supply—in a strategic move termed the "Alchemy of 5%".3 This divergence between retail capitulation and institutional conviction is the hallmark of a market bottoming process, where weak hands transfer assets to long-term treasuries.
Furthermore, the venture capital landscape, often a lagging but sticky indicator of industry health, has recorded nearly 1,200 funding rounds in 2025.4 Late-stage raises, such as RedotPay’s $107 million Series B, signal deep conviction in the payments layer and real-world utility 5, moving beyond the speculative governance tokens of previous cycles.
This week’s report, the final of 2025, dissects this divergence. We analyze why Gold has rallied 71% this year while Bitcoin has corrected 6, explore the regulatory watershed of the GENIUS Act for stablecoins 7, and provide a granular look at the liquidation heatmaps that threaten to trigger substantial volatility in the first week of 2026.8 We posit that the current price stagnation is not a failure of the asset class, but a necessary consolidation phase as the market transitions from retail-driven hype to institutionally-driven utility.
2. Market Overview: The Macro-Crypto Divergence
2.1 The Macroeconomic Backdrop
The wider financial world ends 2025 on a note of euphoric caution. The NASDAQ 100 is attempting to breach the 26,000 level 9, driven by the relentless AI narrative and a stabilizing rate environment. In stark contrast to the risk-on appetite in equities, the commodities sector signals distinct hedging behavior. Gold has broken above $4,500/oz, completing a 71% rally year-to-date.6 This massive move in precious metals indicates that global capital is pricing in significant fiat debasement and geopolitical instability.
This divergence—equities up, gold up—suggests a market that is pricing in both growth and debasement simultaneously. Bitcoin, usually the bridge between these two worlds, has found itself temporarily orphaned. It has underperformed the S&P 500 in Q4 2025 and has significantly lagged behind Gold’s defensive rally. This decoupling is a critical theme for 2026: Bitcoin must re-establish its correlation either as a risk-on tech proxy or a risk-off sovereign hedge. Currently, it is functioning as neither, trapped by ETF outflows and a lack of fresh retail liquidity.10
2.2 Crypto Market Performance
The global cryptocurrency market cap stands at approximately $2.97 trillion, marking a modest 0.68% increase over the last 24 hours.11 This stability masks the underlying churn, where capital is rotating out of underperforming Layer 1s and into specific utility plays.
- Bitcoin (BTC): Trading between $87,308 and $87,984. The asset is down approximately 4-7% on the year depending on the timeframe, a disappointing finish after the Q3 highs.6 The failure to hold the $90,000 level has dampened short-term sentiment.
- Ethereum (ETH): Hovering around $2,942. Despite Bitmine's massive accumulation, ETH has struggled to reclaim the $3,000 psychological barrier this week.11 The price action suggests that the supply shock from institutional buying has not yet translated into price discovery due to low trading volumes.
- Altcoin Performance: The market is highly selective. While legacy assets struggle, newer tokens and specific sectors like Storage (STORJ) show resilience. Solana (SOL) remains a favorite for retail flows, trading at $124.35, while BNB holds strong at $845.84.11
Table 1: Weekly Asset Performance Overview (Dec 22 - Dec 28, 2025)
Data Sources: 6
3. Headlines: Security Failures & Corporate Treasuries
3.1 Security Failures: Flow and Trust Wallet
The week was marred by significant security incidents that remind us of the fragility of the current infrastructure and the persistent risks facing retail participants.
- Flow Blockchain Incident: The FLOW token plunged over 40% following a reported security incident.15 While details remain fluid, market reaction was swift and brutal. This collapse highlights the liquidity risks inherent in altcoins during low-volume holiday periods; without deep order books, panic selling triggers exaggerated price declines. The incident serves as a stark reminder of the technical risks associated with Layer 1 blockchains that are still evolving their consensus and security mechanisms.
- Trust Wallet Hack: A browser extension vulnerability led to a $7 million loss for Trust Wallet users.15 The incident, identified by on-chain sleuth ZachXBT, underscores the persistent "last mile" vulnerability in Web3—the user interface. Even if the underlying blockchain is secure, the access points remain susceptible to Web2-style exploits. Trust Wallet has initiated a compensation process, a necessary move to preserve reputation in a crowded wallet market, but the reputational damage reinforces the "self-custody is hard" narrative that keeps many institutions wary.
- Coinbase Data Breach: In a separate incident, Coinbase's CEO announced the first arrest in India regarding an insider data breach, signaling that centralized exchanges are aggressively pursuing internal bad actors to maintain regulatory trust.15
3.2 Corporate Treasuries: The "Alchemy of 5%"
In a move reminiscent of MicroStrategy’s Bitcoin playbook, Bitmine Immersion Technologies announced it has reached a holding of 4.066 million ETH, representing 3.37% of the total Ethereum supply.3
- Strategy: Chairman Tom Lee of Fundstrat calls this the "Alchemy of 5%," aiming to control a twentieth of the supply of the world's settlement layer. The company’s total crypto and cash holdings now exceed $13.2 billion.3
- Implication: This aggressive accumulation puts a soft floor under ETH prices. Unlike retail holders who sell on panic, treasury holders like Bitmine are geometrically compounding their stakes. This creates a "Supply Shock" dynamic: a significant percentage of ETH is being permanently removed from circulation. While price action is currently dormant, the reduction in float means that any future demand spike will result in aggressive upward price repricing. This is a fundamental structural shift in the Ethereum market that retail traders are largely ignoring.
4. Hot Sectors: Decentralized Storage & The Stablecoin Standard
4.1 Storage & Infrastructure: The Rise of STORJ
While the broader market slept, decentralized storage protocols woke up. STORJ was a standout performer, listed as a top market outperformer with gains cited as high as 40% in some weekly contexts and consistently trading green daily.11
- Catalyst: The acquisition of Storj by Inveniam Capital in late 2025 is the primary driver.16 This isn't just a buyout; it's an integration into enterprise AI and data platforms.
- Utility Thesis: With AI models requiring petabytes of data, the narrative has shifted from "storage for files" to "storage for AI training sets." STORJ's integration into high-performance computing workflows via Inveniam validates the DePIN (Decentralized Physical Infrastructure Network) thesis. The market is beginning to value protocols not on their governance tokens, but on their ability to service real-world compute and storage demands. The synergy between AI growth (driving Nasdaq) and crypto infrastructure is finally materializing in price action for assets like STORJ.
4.2 Stablecoins: The Quiet Giant
The stablecoin market cap sits at $309 billion.17 While slightly down (0.26%) on the week, it remains at historical highs. The dominance of USDT (60% share) continues, but the regulatory moat around USDC is widening with the GENIUS Act.
- Yields & Velocity: The "risk-free" rate in crypto (stablecoin lending) is compressing as more capital enters, yet it remains attractive compared to traditional fiat savings. The sheer volume of stablecoins indicates ample "dry powder" sitting on the sidelines, waiting for a trigger to deploy into risk assets. The fact that stablecoin market cap has not collapsed despite the Bitcoin correction suggests that capital is not leaving the ecosystem; it is merely de-risking into cash equivalents, ready to rotate back in.
5. On-Chain Data: Liquidation Heatmaps & The $90k Wall
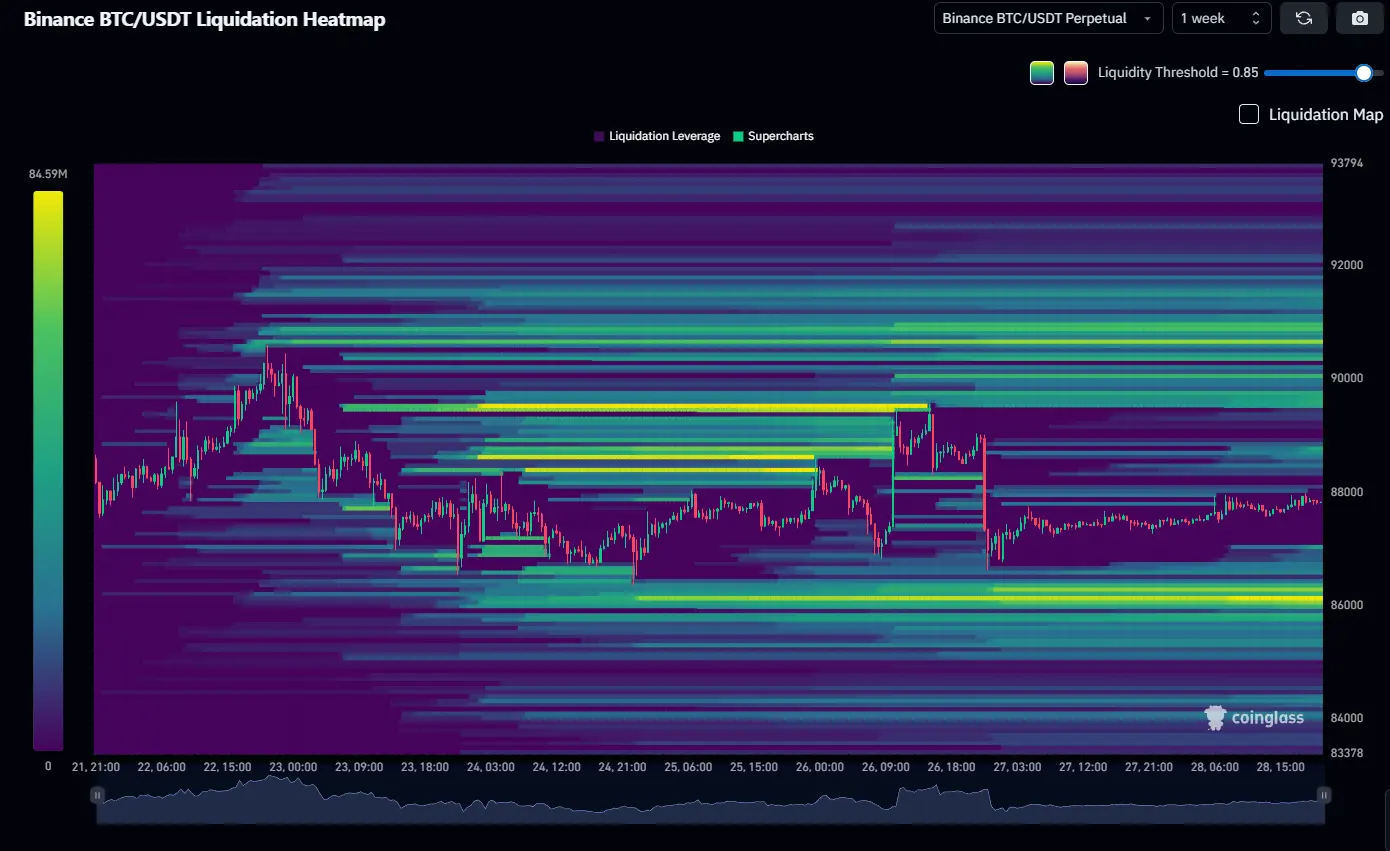
5.1 Liquidation Heatmaps: The Short Squeeze Setup
The most critical data point for traders heading into January 2026 is the Liquidation Heatmap. This metric reveals where leveraged traders will be forced to close their positions, acting as a magnet for price action.
- The Setup: Bitcoin is trading at ~$87,800.
- The Risk: There is a massive concentration of short positions stacked between $90,000 and $98,000.8 Approximately $8.12 billion in short positions are at risk of liquidation if prices move up just 10%.
- The Mechanism: If BTC pushes past $90,000, these forced buy-backs could trigger a "short squeeze," propelling price rapidly toward $98,000. Conversely, long liquidations are clustered below $86,000.
- Implication: The market is currently in a "compressed spring" state. The heavy short interest suggests that many traders are betting on a continued downturn or a break of the $86k support. If the macro environment (e.g., Non-Farm Payrolls) provides a spark, the fuel for a rapid rally is already present in the order book.
5.2 Total Liquidations & ETF Flows
- 2025 Total Liquidations: Over $150 billion was liquidated in the cryptocurrency market in 2025, with an average of $400-$500 million daily.18 This highlights the highly leveraged nature of the current participant base. The market is dominated by institutional algorithms and high-frequency traders, with very little "sticky" retail liquidity to buffer volatility.
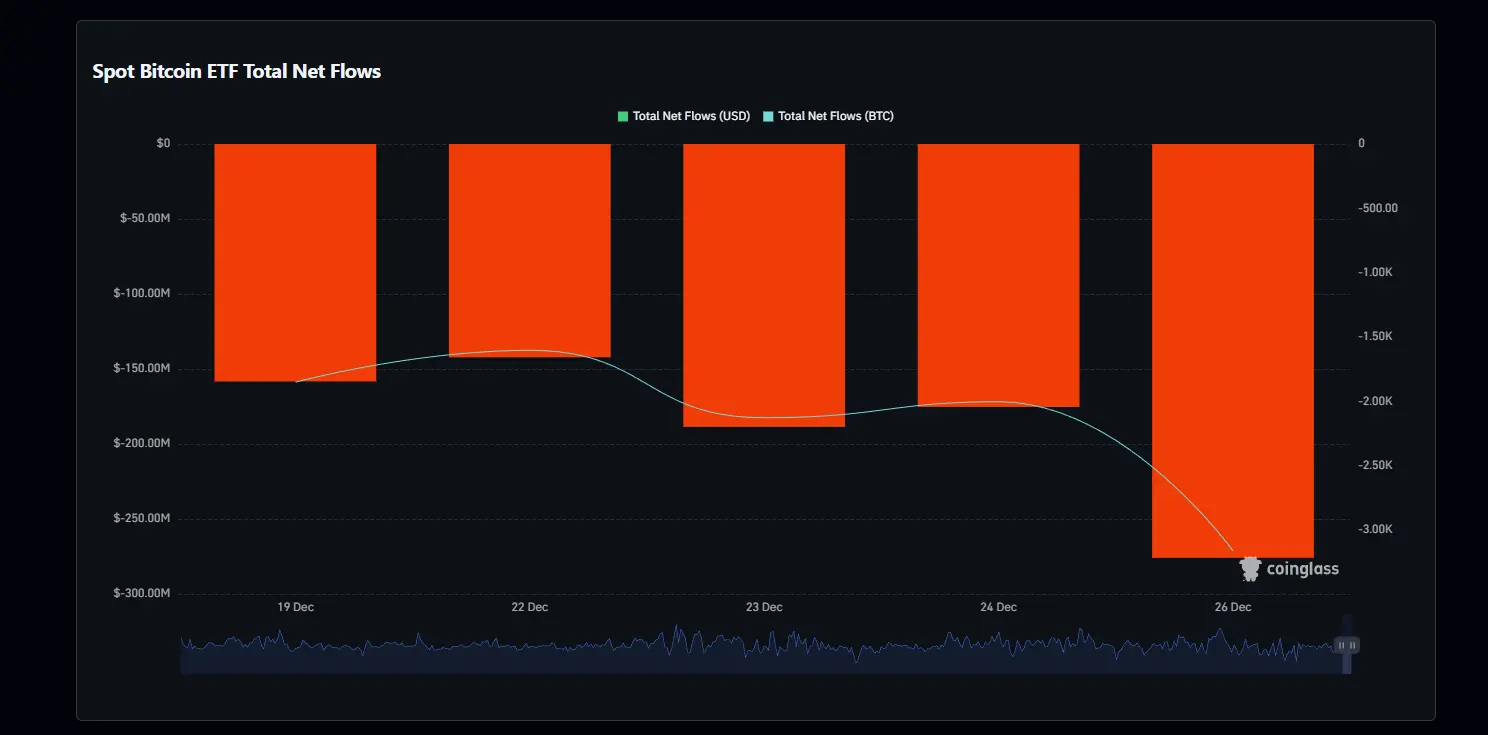
- ETF Flows: For the first time since their inception, US Spot Bitcoin ETFs have entered a phase of net outflows, shedding nearly $500 million in the week leading up to Christmas.10
- Interpretation: This is likely year-end tax loss harvesting and portfolio rebalancing rather than a fundamental loss of faith. Institutions are realizing losses to offset gains elsewhere. However, until these flows reverse, the "infinite bid" narrative is paused. We expect these flows to potentially flip positive in the first week of January as new tax years begin.
6. Chart Interpretation: Technical Structures in a Low-Liquidity Environment
6.1 Bitcoin (BTC) Technical Analysis
- Price Structure: BTC is trading in a tight consolidation range between $86,000 (Support) and $90,000 (Resistance). The price action is characteristically choppy, typical of holiday low-volume periods.
- Indicators: The RSI (Relative Strength Index) on daily timeframes is showing signs of bullish divergence—price is making lower lows or equal lows, while momentum is inching higher.10
- Key Levels:
- Resistance: $88,200 (local high) and $90,000 (psychological/liquidation wall). A close above $90,500 is required to invalidate the bearish short-term trend.
- Support: $86,000 is the line in the sand. A break below this level opens the door to $82,000, where the next major liquidity cluster resides.
6.2 Ethereum (ETH) Technical Analysis
- Price Structure: ETH is effectively range-bound below $3,000. The $2,900 level has acted as a local floor, bolstered by the Bitmine accumulation news.
- Relative Strength: ETH/BTC continues to struggle, reflecting the market's preference for Bitcoin's liquidity or Solana's volatility. However, the downside seems limited given the massive supply absorption by treasuries.
7. Fundraising: The Capital Engine Shifts to Utility
Despite the price stagnation in the secondary market, the primary market (venture capital) remains robust, indicating long-term confidence.
7.1 Weekly Stats (Dec 14-20)
- Total Activity: At least 22 funding rounds were tracked this week.
- Series B Lead: RedotPay raised $107 million in a Series B round led by Pantera Capital, Goodwater Capital, and others.5
- Significance: RedotPay focuses on crypto-to-fiat payments. A raise of this magnitude for a payments infrastructure company suggests that VCs believe "spending crypto" is the next major adoption vector, moving beyond "trading crypto."
- Seed Activity:
- ETHGAS: Raised $12 million to optimize Ethereum gas efficiencies.5
- Strata: Raised $3 million for infrastructure.5
- Trend: Undisclosed and Strategic rounds led the annual count.4 This opacity suggests VCs are taking larger, quieter positions to avoid front-running by retail in a low-liquidity market.
7.2 Annual Context
2025 saw a total of 1,179 funding rounds.4 While the frenetic pace of 2021 has slowed, the quality of deals has improved. Capital is concentrating in:
- Infrastructure (L2s, Interoperability)
- DePIN (Decentralized Physical Infrastructure)
- Real World Assets (RWA) & Payments
The era of funding "whitepaper-only" projects is over. Investors now demand revenue models and product-market fit.
8. Regulation: The GENIUS Act & Global Compliance
2025 has been the year of the Stablecoin from a regulatory perspective. The regulatory fog is lifting, revealing a landscape where compliance is the price of admission.
8.1 The GENIUS Act & MiCA
- United States: The GENIUS Act has progressed significantly, aiming to create a federal framework for stablecoin issuers.7 This legislation is crucial for integrating stablecoins into the formal banking system.
- Europe: The full rollout of MiCA (Markets in Crypto-Assets) continues to set the global standard.
- Global Impact: Over 70% of jurisdictions reviewed by TRM Labs have advanced stablecoin regulations this year.19 This global synchronization creates a safe harbor for institutional capital to utilize stablecoins for settlement, potentially unlocking trillions in transaction volume.
8.2 Geopolitical Mining Shifts
- Russia: Reports indicate the US is eyeing crypto mining operations at a disputed nuclear plant in the Russia-Ukraine conflict zone.15
- Policy Shift: Russia itself is shifting from a stance of "complete rejection" to "positive entry" regarding cryptocurrency.20 This pivot suggests that sanctioned nations are increasingly viewing Proof-of-Work mining as a strategic tool for energy monetization and sanctions evasion. This politicization of hashrate adds a layer of complexity to the regulatory outlook for 2026.
9. Institutional Analysis: The "Alchemy of 5%"
The behavior of Bitmine Immersion Technologies provides the most bullish signal in the current market.
- The Data: Holding 4.066 million ETH (3.37% of supply).3
- The Philosophy: Chairman Tom Lee's "Alchemy of 5%" strategy is a bet on scarcity. If a single entity controls 5% of the supply of the world's primary smart contract platform, the pricing power shifts dramatically from sellers to holders.
- Comparison: This is distinct from MicroStrategy's Bitcoin play. MicroStrategy holds a store of value (BTC). Bitmine holds a yield-generating productive asset (ETH). As staking yields provide a floor to returns, Bitmine's strategy acts as a massive vacuum for liquidity.
- Market Impact: Currently, this accumulation is masked by low retail volume. However, the "free float" of ETH is shrinking rapidly. When demand returns—likely driven by ETF inflows or new DeFi applications—the supply shock will be immediate. This accumulation creates an "institutional floor" below which price is unlikely to sustain.
10. Macroeconomic Analysis: Gold, Equities, and the Search for Value
To understand Bitcoin's current malaise, we must look at Gold.
- Gold's 71% Rally: Gold reaching $4,500 9 is a screaming signal that the market fears fiat debasement. Central banks are buying gold at record rates to diversify away from the US Dollar.6
- Bitcoin's Lag: Why hasn't Bitcoin followed? Two reasons:
- Beta to Tech: Bitcoin is still correlated with the Nasdaq (which is up ~20%) but lacks the AI growth narrative that is driving tech stocks.
- Maturity: As an asset class, crypto is undergoing a "cleaning out" of leverage (witness the $150B liquidations). Gold, being an unleveraged asset for central banks, does not suffer from these liquidation cascades.
- Search Trends: The "Normie" interest is dead. Google Trends for "Crypto" is at 19/100.1 This is historically a Buy Signal. High search volume usually correlates with market tops (max greed), while low volume correlates with accumulation zones (max indifference). The current macro environment—high gold prices, rising equities, low crypto interest—is the perfect setup for a contrarian entry.
11. Outlook for Next Week: The January Effect & Key Unlocks (Dec 29 - Jan 4)
As we transition into 2026, several key events will dictate the immediate price action.
11.1 Economic Calendar
- January 2, 2026 (Friday): US Non-Farm Payrolls.21 This is the first major macro data point of the year.
- Scenario A (Hot Number): If job growth is too strong, fears of inflation returning may strengthen the DXY (Dollar Index), putting pressure on Bitcoin.
- Scenario B (Cool Number): A softening labor market cements the case for Fed rate cuts in Q1, which is bullish for risk assets like Crypto.
- Fed Policy: Markets are increasingly pricing in a rate cut in January.11 Confirmation of this expectation would be a major tailwind.
11.2 Token Unlocks & Market Events
- January 1, 2026: SUI Token Unlock. Approximately $60.39 million worth of SUI tokens will unlock.22
- Analysis: SUI has been a strong performer relative to other L1s. While a $60M unlock is substantial, the market often "front-runs" these events. Traders short the token in anticipation of the unlock, leading to a dip before the date. Once the unlock passes without a massive dump, the short covering often leads to a rally. Watch SUI price action closely on Jan 1-2.
- HYPE Token: Vesting schedules for Hyperliquid's HYPE token continue, but major cliff unlocks are deferred, reducing immediate sell pressure.23
- January 1 Effect: Historically, assets that were sold off in December for tax loss harvesting (often DeFi tokens and underperforming alts) see a "rebuy" phenomenon in the first week of January. Expect potential rotation into beaten-down sectors.
11.3 Trading Strategy Summary
- The Pivot: Watch the $90,000 level on BTC. A high-volume breakout targets the $98k liquidity cluster.
- The Hedge: Keep an eye on the Gold/BTC ratio. If Bitcoin begins to catch up to Gold's performance, the rally could be explosive.
- The Trap: Avoid over-leveraged long positions before the Non-Farm Payrolls print on Friday. The liquidation heatmap shows longs are vulnerable below $86k.